
Fraketology: February 17, 2026
The bubble remains quite difficult to sort out. Consider the following blind resumes:
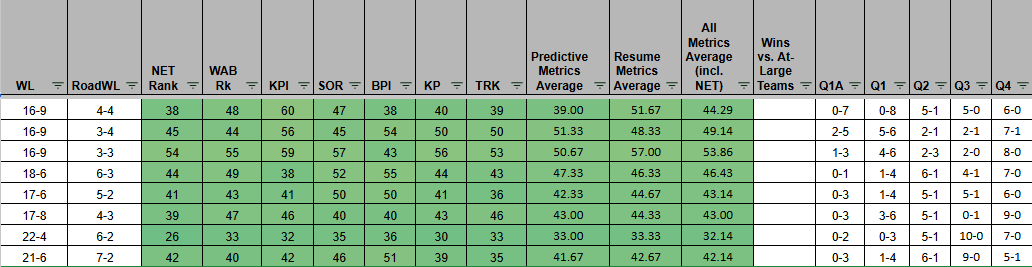
The immediate bubble picture at this moment.
For me, it is quite difficult to discern these teams from one another. And no single criteria can really eliminate or include everyone. At first blush, one might be inclined to start by tossing the two teams that have 0 Q1 wins. A noble criteria, and one I put a decent amount of weight on (see Miami (OH)). However, the team with the 22-4 record, but 0-3 in Q1 has metrics—both resume and predictive—that would make it truly shocking if they were omitted—33 predictives average, 33.33 resume metrics average and 32.14 all metrics, as a NET of 26 pulls those 2 averages up. That’s compared with the 16-9 team with 0 Q1 wins, who is outside the picture from a resume metrics average perspective, and right on the cusp in the all-important WAB. However, their NET and predictives are in-line with a bid. The other distinction is that the 16-9 team has had (and failed) to win a Q1 game in 8 opportunities, the 22-4 team has only had 3 attempts.
The team currently 54th in NET also presents an interesting case. They are a very good, relative to the bubble, 4-6 in Q1. The 2nd most wins and 2nd best win percentage on the bubble. However, the metrics are too far afield to warrant inclusion, particularly the resume metrics average of 57 and the WAB of 55. The predictives are not high enough to save this resume, and so, for my mind, they are out, and actually the 4th team out.
As an example of how narrow the margins can be in these things, the 45th NET team is 5-6 on Q1, including 2-5 in Q1A, the best in both categories among these bubble teams. So comparing them, to the 54th NET team, you would think that this resume is also in trouble, particularly once you factor in the Q3 and Q4 losses this team has suffered. However, the resume metrics—an average of 48.33 and a WAB of 44 profile out meaningfully better than the 57 and 55, respectively, of the 54th NET team. There is also the NET gap of 9 ranks.
There are also a trio of teams that are identically 1-4 in Q1, with 0 Q1A wins, each with 1 loss in Q2, 2 of them with 1 loss in Q3, and one with a Q4 loss. You could once again be forgiven for thinking the fate of these teams would rise and fall together, given how identical their resumes are. Their resume metrics averages are 41.67, 42.33, 47.33, and predictive averages of 42.67, 44.67, 46.33. Their WABs are 40, 43, and 49. To complicate things, the team with the slightly better metrics across the board is also the team with the Q4 loss, as opposed to Q3 losses for the other 2. So the question becomes, is the slight difference in metrics enough to overcome the difference between a Q3 and a Q4 loss? I felt like it is, particularly given the healthy WAB of 40 for the team with the Q4 loss.
The last team has the clear best resume, sporting the 3rd highest NET (39), a WAB within range (47), and an overall metrics average that puts them 3rd among this group. What sets them above those with better metrics is their 3-6 record in Q1, 3rd best among this bubble group (while having better metrics than the teams with the best 2 Q1 records), and lacking the bad losses of the team with the best Q1 record.
Ultimately, here’s how I sorted these resumes:
Line 1 - Ohio St. - 3rd team out - Held back by the poor Q1 record, which is also dragging down their resume metrics average, particularly a KPI rank of 60.
Line 2 - TCU - 2nd to last team in - I am of the belief that their gaudy Q1 record is more than enough to compensate for middling metrics and the 2 bad losses (2 things which are undoubtedly connected)
Line 3 - WVU - 4th team out - the lack of bad losses and the 4-6 Q1 record simply wasn’t enough to overcome the worst metrics of this bubble group.
Line 4 - SDSU - 1st team out - this was where things got tricky, SDSU, New Mexico and Santa Clara all have strikingly similar resumes. Unfortunately for the Aztecs, I had Santa Clara a smidge ahead of SDSU, and that happens to be where this cut line fell.
Line 5 - New Mexico - 2nd team out - I had New Mexico ranked a smidge below SDSU, based on the metrics, the only real separation between their resumes
Line 6 - Georgia - 4th to last team in - the best of this bunch, for the reasons outlined above, basically a combination of their metrics with a decent Q1 record
Line 7 - St. Mary’s - 3rd to last team in - the metrics here are imply too good to ignore. I’m probably overly pessimistic on the Gaels’ seeding here, but I find it difficult to reward a team that has not won a Q1 game.
Line 8 - Santa Clara - last team in - the metrics give them the slight edge over New Mexico and SDSU, despite the Broncos’ Q4 loss.
Without further ado, here’s the bracket:
Seed List
Michigan
Duke
Arizona
Iowa St.
UConn
Houston
Purdue
Illinois
Florida
Nebraska
Gonzaga
Vanderbilt
Virginia
Kansas
Texas Tech
Michigan St.
Louisville
Alabama
Arkansas
St. John's
Tennessee
North Carolina
Saint Louis
BYU
Kentucky
Wisconsin
Clemson
Utah St.
Villanova
NC St.
Miami (FL)
Auburn
Iowa
Indiana
SMU
Texas
UCF
Last Four Byes
Texas A&M
Southern California
Missouri
UCLA
Last Four In
Georgia
Saint Mary's (CA)
TCU
Santa Clara
Other Auto Bids
South Fla.
McNeese St.
Belmont
Liberty
Yale
Akron
High Point
Hofstra
Hawai'i
Utah Valley
Troy
Austin Peay
St. Thomas (MN)
Navy
Merrimack
ETSU
UT Martin
Wright St.
Montana St.
Howard
LIU
Bethune-Cookman
Vermont
First Four Out
San Diego St.
New Mexico
Ohio St.
West Virginia
Next Four Out
Virginia Tech
Seton Hall
California
Miami (OH)